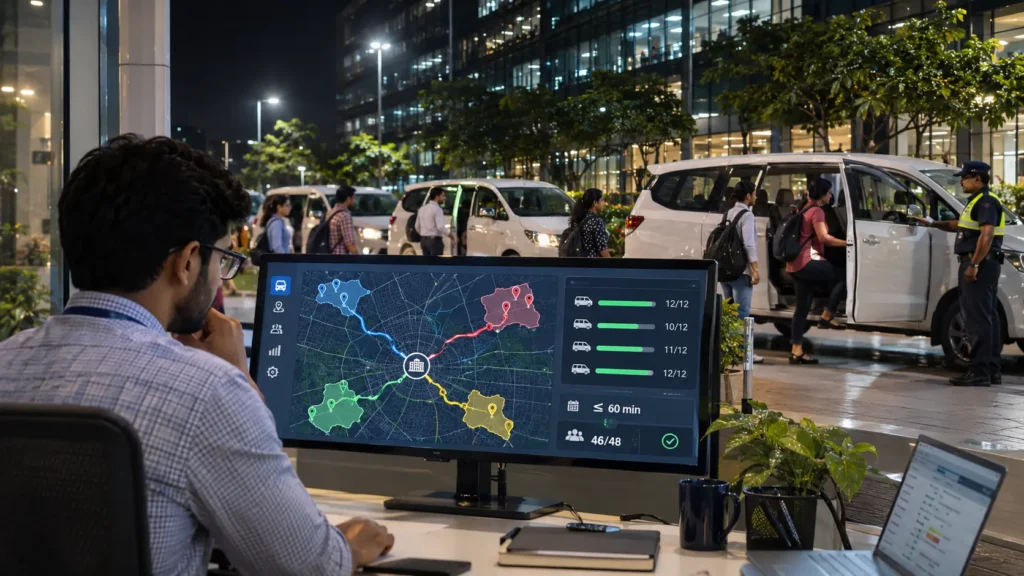
An employee transport MIS report is a structured summary of trips, safety, compliance, and cost that tells the transport team what happened and what needs action. The daily report shows today’s exceptions, the weekly report shows trends, and the monthly report supports billing and governance reviews.
MIS stands for Management Information System, and a report from it turns raw trip data into numbers managers can act on. Many teams collect data but have no standard format, so each vendor sends a different file and nobody can compare weeks or months.
This guide provides a template for each cadence, the formulas behind the key numbers, and a short setup process.
What Is an Employee Transport MIS Report and Who Reads It?
An employee transport MIS report is a recurring report that compares planned trips with actual trips, and it flags what broke the rules. Each cadence has a different reader and a different job.
| Report | Main reader | Job |
| Daily | Transport desk and command centre | Fix today’s exceptions |
| Weekly | Transport manager and vendor | Spot trends and agree actions |
| Monthly | Admin head, finance, HR, and security | Review cost, compliance, and SLAs |
The need is real. A March 2026 Routematic and Research NXT benchmark found that about 60% of GCCs lack a fully integrated transport management system, which usually means they build reports by hand.
What Goes Into a Daily Transport MIS Report Format?
A daily transport MIS report format lists every shift’s trips, then highlights the exceptions the team must close. Keep it to one page, and send it at a fixed time after each shift ends.
| Field | What to record |
| Date, shift, route ID | Which trip the line refers to |
| Vehicle and driver | Registration number and driver name |
| Scheduled and actual pickup | Planned and actual times |
| On time (Yes or No) | Arrival against the shift login time |
| Riders rostered and boarded | The gap gives the no-show count |
| Escort present | Required on routes with women at night |
| Safe drop confirmed | Yes for every woman, with time |
| Incident or SOS | Type, time, and status |
| Breakdown or substitution | Reason and replacement time |
Add an exceptions block at the top that lists late trips, no-shows, route deviations, open incidents, and documents expiring in the next seven days. A few sample lines show the style:
- Route 14, 10 PM shift: arrived 12 minutes late because of a vehicle substitution; replacement logged at 9:05 PM.
- Route 22: one no-show; rider informed the desk after pickup, so the vehicle waited four minutes.
- Vehicle KA 01 XX 0000: fitness certificate expires in six days; vendor notified.
Here are the daily formulas, with an illustration:
- Trip completion = trips completed ÷ trips scheduled × 100. If 118 of 120 trips ran, completion is 98.3%.
- On time % = trips on time ÷ trips completed × 100. If 112 of those 118 arrived on time, the figure is 94.9%.
What Should a Weekly Transport MIS Report Template Show?
A weekly transport MIS report template shows trends and repeat offenders, because one bad day looks different from a bad week. It should compare the week with the previous week.
| Metric | Formula | How to read it |
| Seat occupancy | Riders ÷ seats offered × 100 | Low values point to too many routes |
| No show rate | No shows ÷ riders rostered × 100 | High values point to roster problems |
| Late trips by route | Count per route, top five | Shows which routes need a redesign |
| Route deviation alerts | Count and cause | Shows driver or map issues |
| Incident closure time | Time from alert to closure | Shows command centre speed |
| Substitution rate | Replaced vehicles ÷ total trips × 100 | Shows fleet reliability |
| Complaints | Count and resolution status | Shows rider experience |
Ask the vendor to attend the weekly review, because the late routes and open incidents are easier to fix when both sides read the same numbers. Use the review in this order:
- Read the trend lines for on-time %, occupancy, and no-shows.
- Take the top five late routes and decide the fix for each.
- Review every incident that stayed open beyond your target.
- Record each action with an owner and a date, and check it next week.
What Should a Monthly Transport MIS Report Template Cover?
A monthly transport MIS report template covers cost, compliance, safety, and vendor performance, since these decide contract reviews and budget talks. It should reconcile billing with the trips that actually ran.
| Section | What to include |
| Cost | Total spend, cost per employee trip, cost by business unit |
| Billing | Invoiced distance against GPS distance, with ghost trips and duplicates |
| Service | On-time %, occupancy, and no-shows, compared month-on-month |
| Safety | Safe drop rate, SOS log with root cause, escort compliance |
| Compliance | Driver licence and badge validity, vehicle fitness and permit status |
| Vendor SLAs | Targets against actuals, with any penalties |
Two formulas matter most here. Cost per employee trip equals total cost divided by employee trips, so ₹18,00,000 across 6,000 trips gives ₹300. Billing variance equals invoiced distance minus GPS distance, so 52,000 km invoiced against 48,500 km on GPS leaves 3,500 km, or 6.7%, to question.
Routematic’s case study on automated billing shows why this section matters, because it uncovered ₹12 crore in hidden transport costs.
How Do You Build the Report Step by Step?
You build it by fixing the KPIs first and the format second. Follow these steps:
- Choose the KPIs and owners. Pick no more than ten metrics, and name one owner for each.
- Source data from GPS trip logs. A vendor-typed summary is a claim; a GPS log is evidence.
- Standardize the fields. Use the tables above so every vendor reports in the same format.
- Set thresholds. Run one month to find your baseline, then agree targets with each vendor.
- Fix the delivery time. Send daily reports within a set number of hours after each shift ends.
- Track actions. Every flagged item should have an owner, a due date, and a closing note.
How Does Routematic Produce These Reports?
Routematic generates reports from live trip data, reducing manual compilation. The platform works in this order:
- GPS tracks every trip, and a 24×7 command centre watches live trips and alerts.
- Automated alerts flag vehicle and driver compliance issues, and a spot-check module supports audits.
- Reporting covers 150+ metrics with drill-down, so teams can move from a monthly summary to a single trip.
- A billing audit report validates invoices against actual trips and catches ghost trips and overbilling.
- Audit-ready digital records keep the trip history available for reviews.
Routematic reports 97% on-time arrival, 100% female-safe drop confirmation, and 12-18% cost savings. In one AI routing case study, a Bengaluru firm cut monthly trips by 8.7%, and trips per vehicle rose by 20%.
It serves 400+ enterprises across 24 cities, including 125 GCCs, as described on its GCC employee transportation page. For the safety checks behind the report, see this guide to women’s safety in corporate transportation.
Want these reports for your shifts? Talk to Routematic for a walkthrough.
FAQs
Should the vendor or our team prepare the MIS report?
Your team should own the format and the targets, and the vendor should supply the data. Reports compiled only by the vendor are harder to challenge, so check them against GPS logs.
What is the difference between an MIS report and a dashboard?
A dashboard shows live numbers, while an MIS report is a fixed snapshot for a period that people review and sign off on. Teams usually use the dashboard for daily control and the report for meetings and records.
How do we set targets in the first month?
Do not set targets before you have data. Run the templates for four weeks, record the baseline for each metric, and then agree targets with your vendor.
How long should we keep MIS data?
Keep it for as long as your contracts and policies require, and ask your legal team to confirm the limits. Delete or mask personal details once you no longer need them.
How should the report handle roster changes and hybrid days?
Report against the final roster after the cut-off, and show late changes as a separate line. This keeps no-show and occupancy figures fair on days when attendance moves.
About the author

Sandeep Padhi
Chief Operating Officer, RouteMatic
As COO of RouteMatic, Sandeep Padhi brings extensive expertise in transport operations, fleet management, and enterprise mobility. He shares practical insights on scaling transportation programs, operational excellence, compliance, driver ecosystems, and building reliable mobility solutions for modern enterprises.